TOC
Profiling is 80% of optimization. It can help you to better understand what’s happening and find points for optimization. I’ll be using this simple code to generate example results
import time


def fibonacci_of(n):
    if n in {0, 1}:  # Base case
        return n
    return fibonacci_of(n - 1) + fibonacci_of(n - 2)


def hello_world():
    print("Hello World!")
    time.sleep(0.01)


if __name__ == "__main__":
    fibonacci_of(25)
    hello_world()
cProfile
cProfile
is built-in Python module for collecting statistics
on how many times different parts of the script are called and how long does each call take.
You can run it from command line and save the results to the binary file for further analyze with -o <filename> option:
python -m cProfile -o program.prof main.py
if your program requires arguments no problem:
python -m cProfile -o program.prof main.py --arg=1
snakeviz
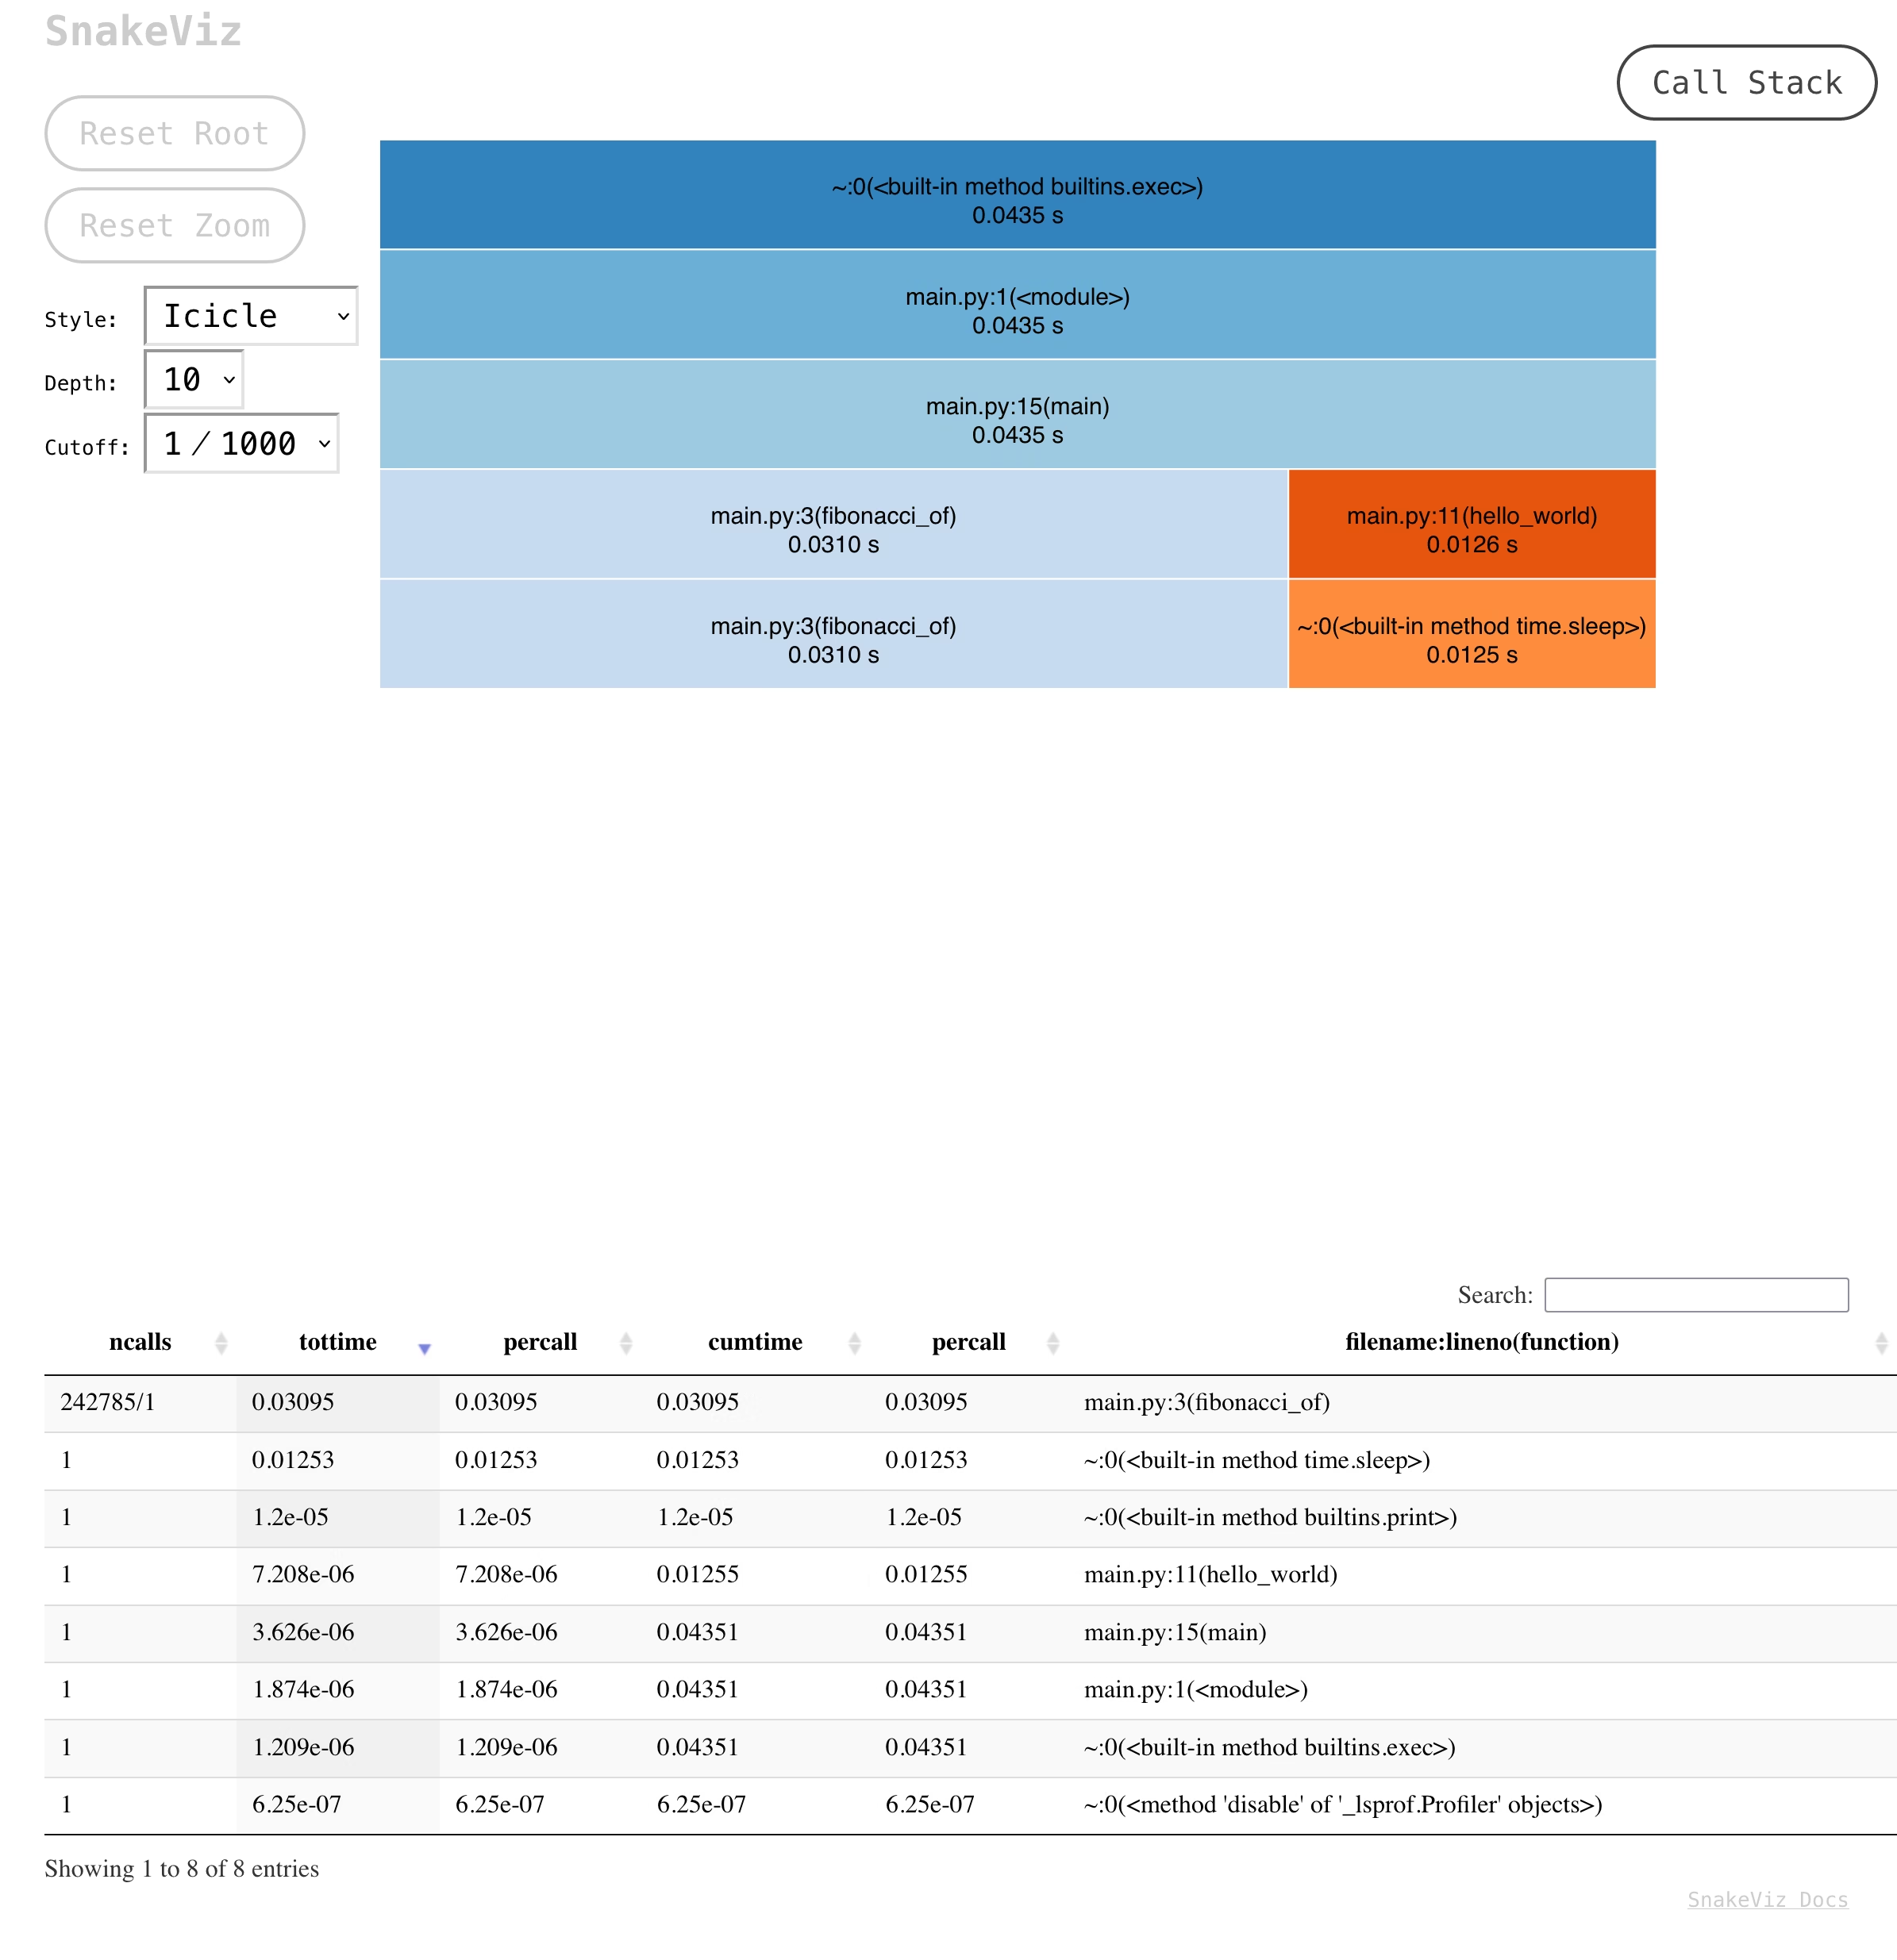
After getting the profiling results, there are a lot of visualization tools built on top of this, one example is snakeviz
pip install snakeviz
snakeviz program.prof
snakeviz runs a local webserver that returns an interactive webpage with visualisation results, so if you are working on remote environment over ssh, first you need to download the profiling results (program.prof) into your local computer and then run the snakeviz.
gprof2dot
gprof2dot
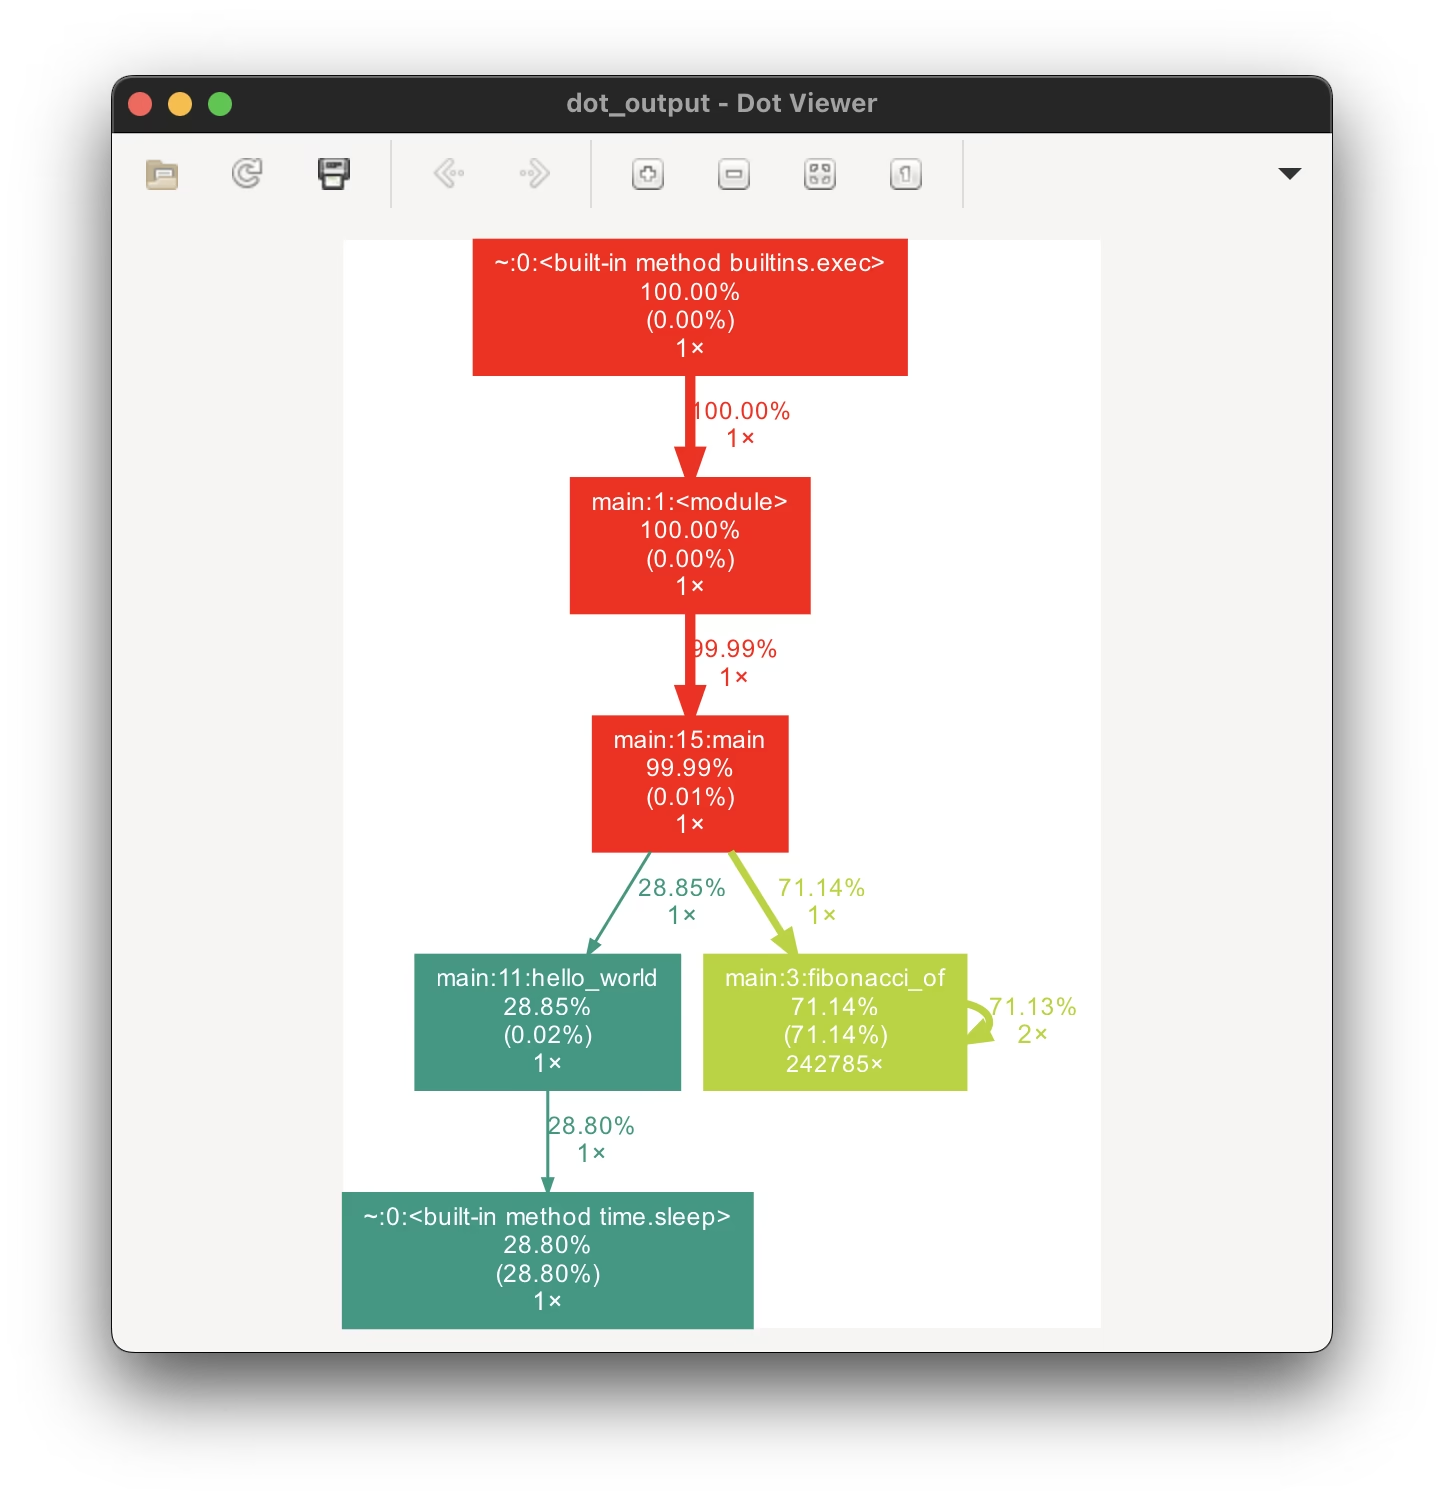
is a powerful tool that can convert cProfile (and many other profilers) results into a dot graph.
The latter can then be visualised and inspected with xdot. This combination requires few more dependencies but gives interactive graph with a lot of information.
pip install gprof2dot
Next, install xdot: On Mac you can use brew:
brew install xdot
Debian:
apt install gir1.2-gtk-3.0 python3-gi python3-gi-cairo python3-numpy graphviz
pip install xdot
To get to the graph first you need to convert .prof file into dot graph with gprof2dot using -o <dot_file> option. Then read that file with xdot
gprof2dot -f pstats program.prof -o dot_graph
xdot dot_graph
Graph shows you that 71.14% was spent in fibonacci_of the same method was called 242785 times and it’s calling itself twice (2x) each time
Memory profiling
Memray
Memray can show the breakdown of memory consumption for functions as well as timegraph of memory usage, but uses quite a lot of memory itself. It can be useful to inspect what parts of the program takes more memory and find potential points for optimisation.
pip install memray flamegraph
python -m memray run main.py --arg=1
Running the command will generate memray-<script_name>.bin file, which can be used to create html report:
python -m memray flamegraph memray-<script_name>.bin
memory-profiler
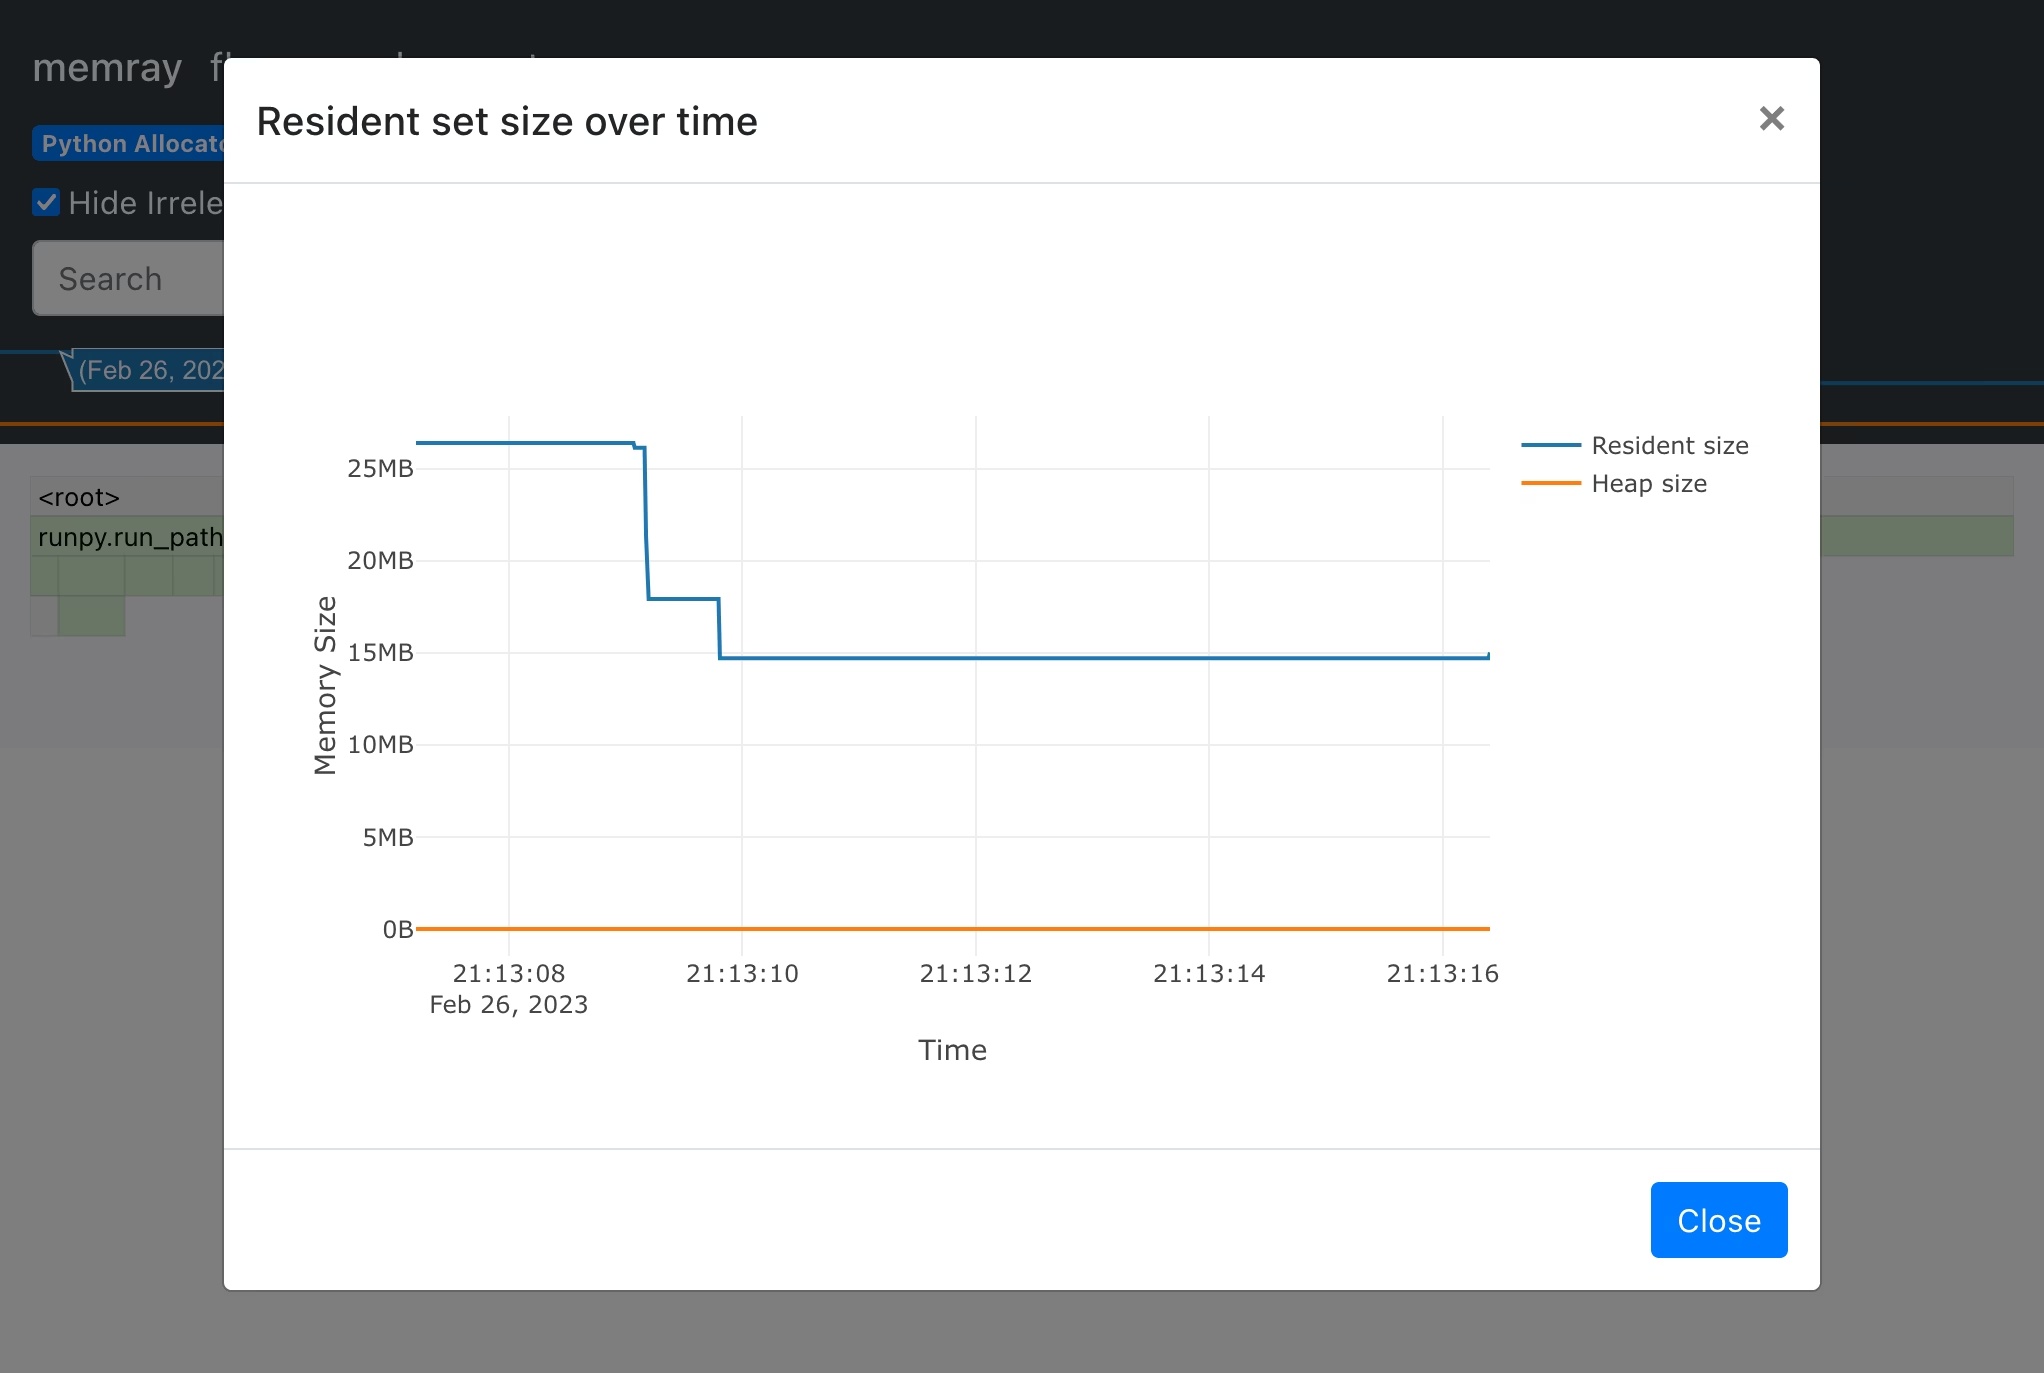
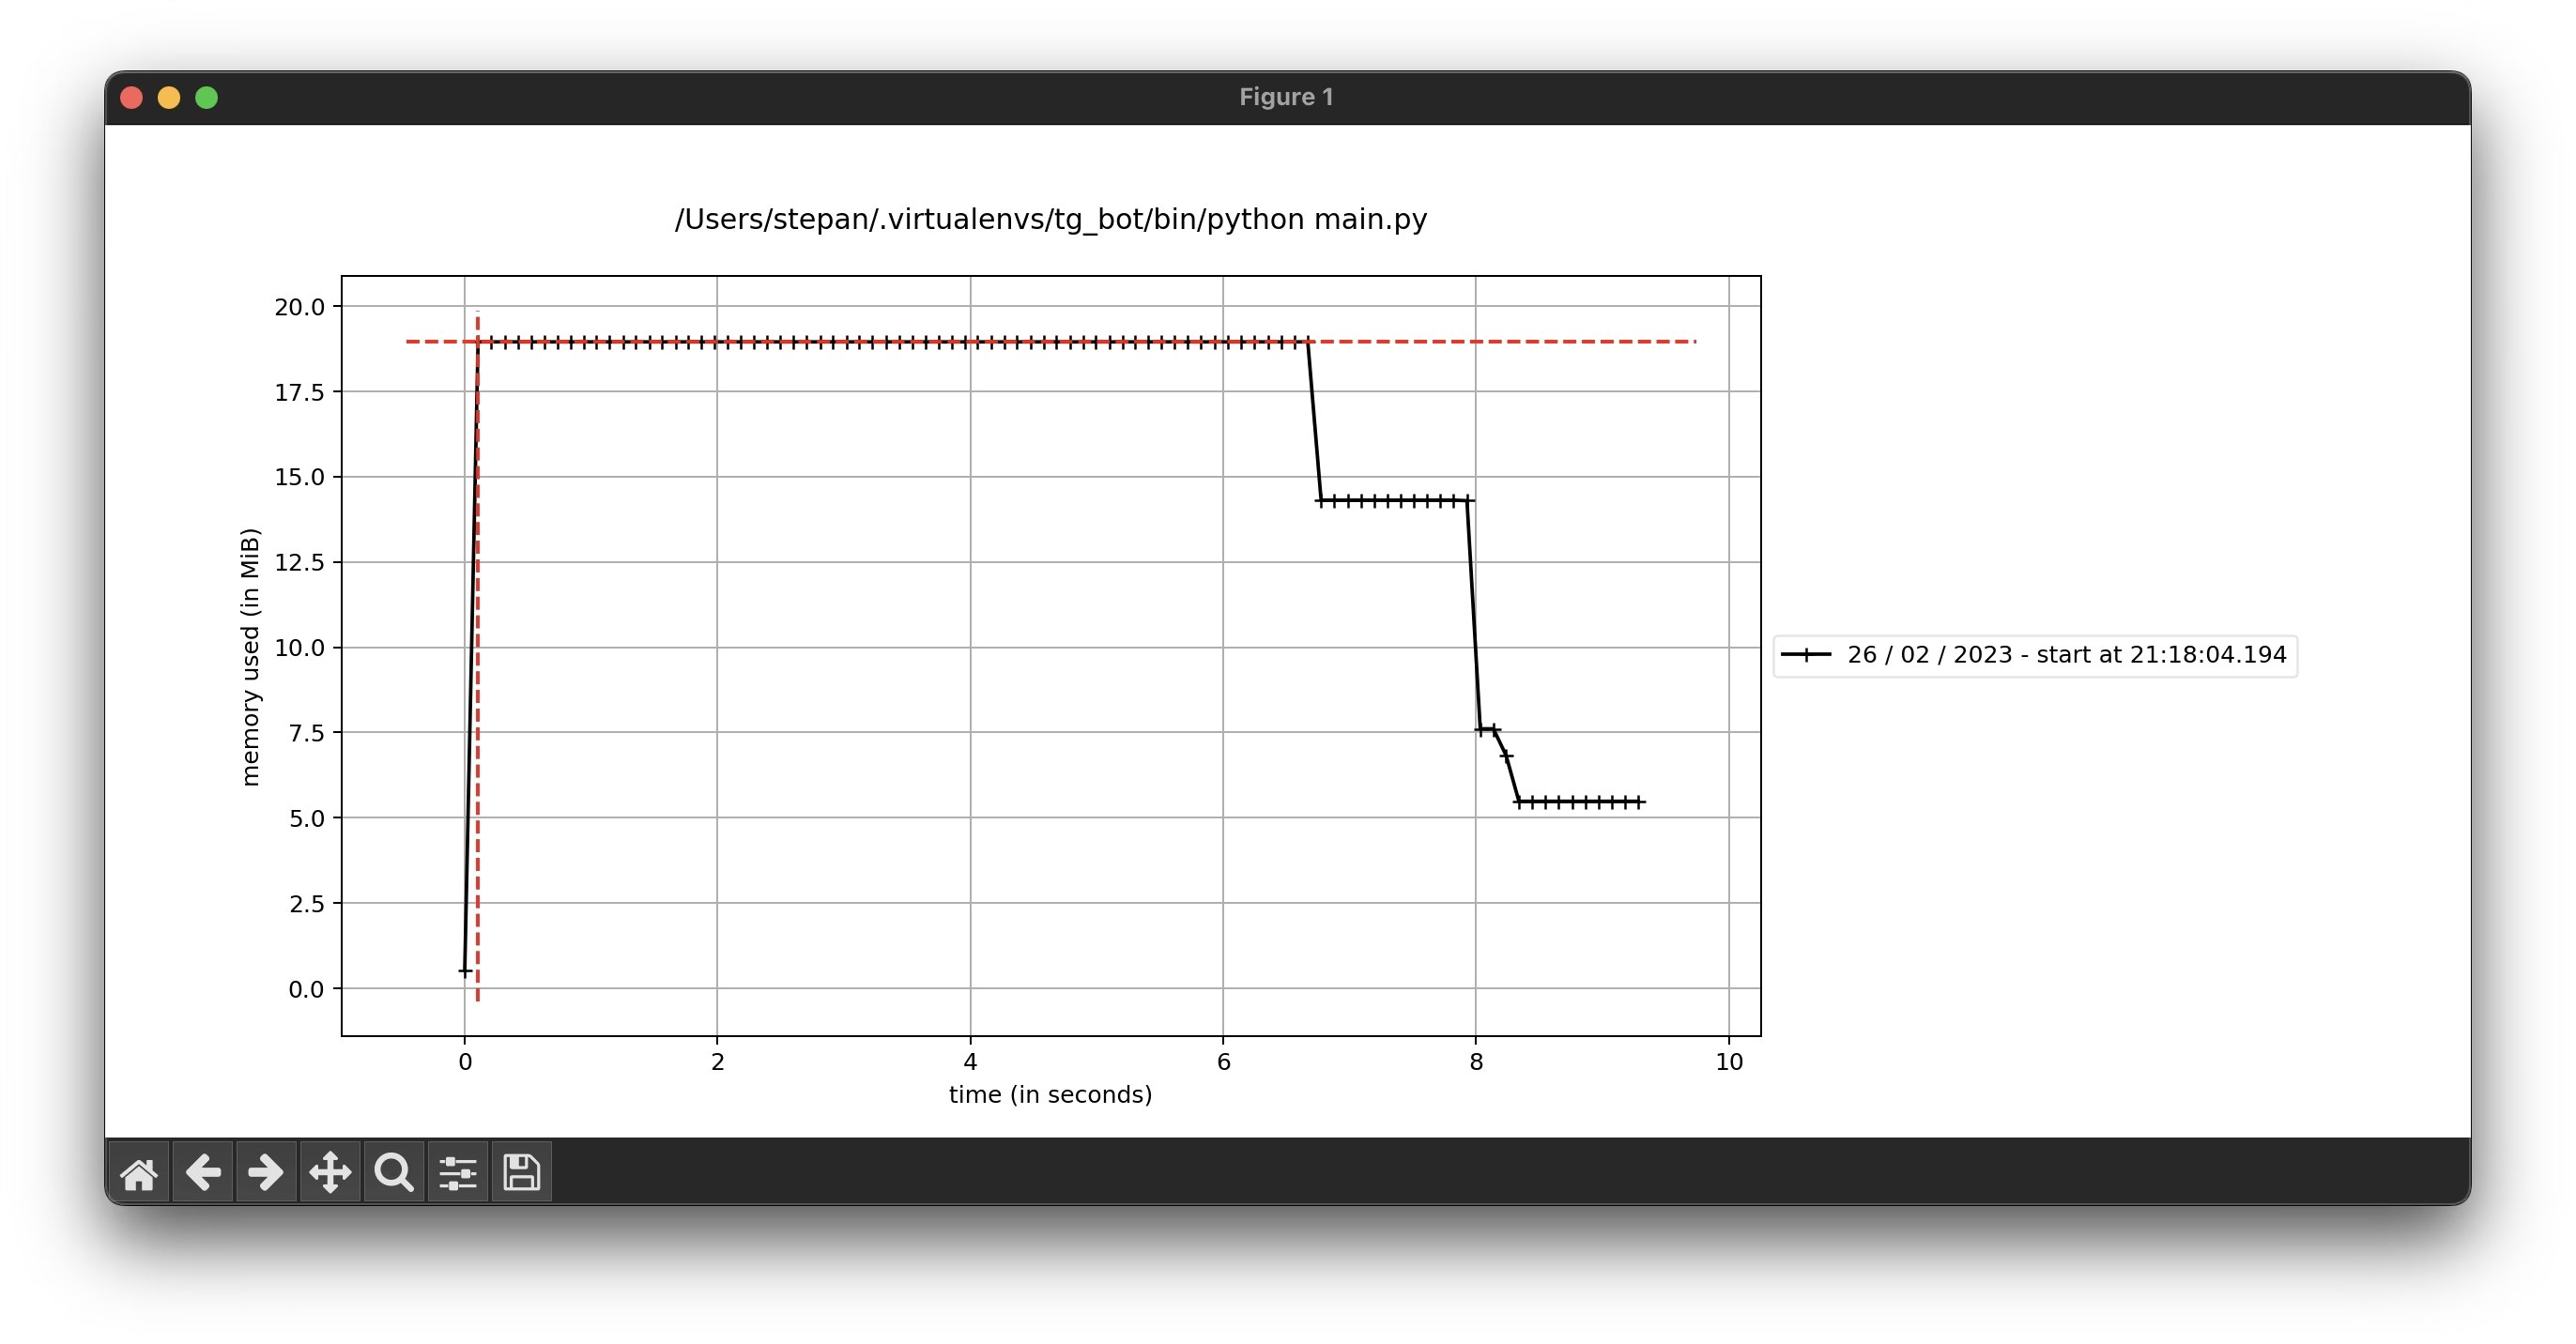
memory-profiler can generate a simple memory usage time graph and is more lightweight than memray.
pip install memory_profiler matplotlib
python -m mprof run <script_name> <script args>
The profiler will generate mprofile_<datetime>.dat file that can be used to draw the plot
mprof plot mprofile_<datetime>.dat
This command uses matplotlib and must be used on local machine.
Reloadium
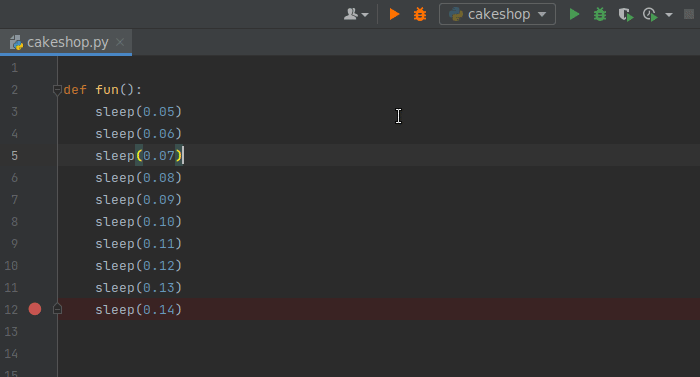
Displays progress of function frames and provides timing information profiling and hot reloading from the IDE: reloadium.io
Once you installed the plugin, usage is pretty straightforward as can be seen from the gif below: